
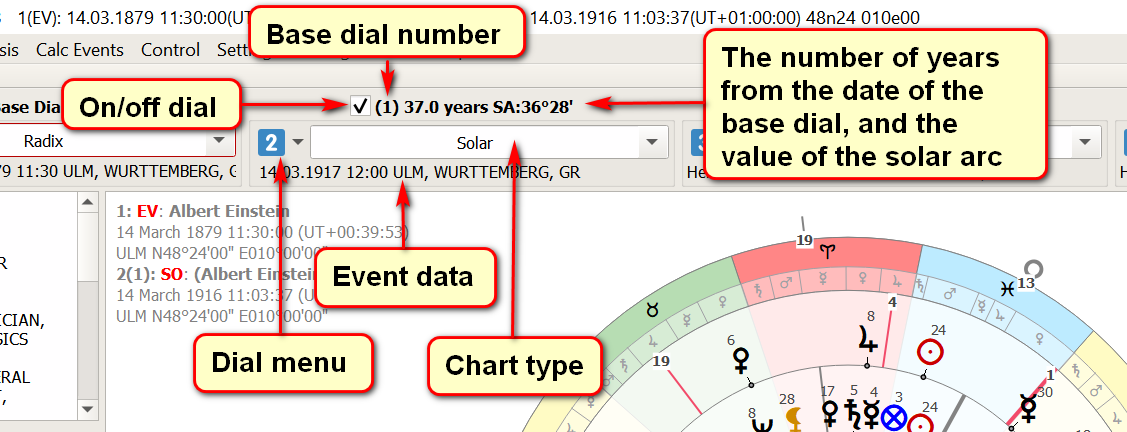
In addition to the name of the program and its version, the data of dials are duplicated in this area, which can be disabled in General settings.

In the relevant sections of the manual, each of its elements is analyzed in detail.
In this area, you can duplicate the selected menu items in the form of icons. The setting is done in Settings/Sidebars/Setting up panels. You can quickly access the panel settings from the context menu.
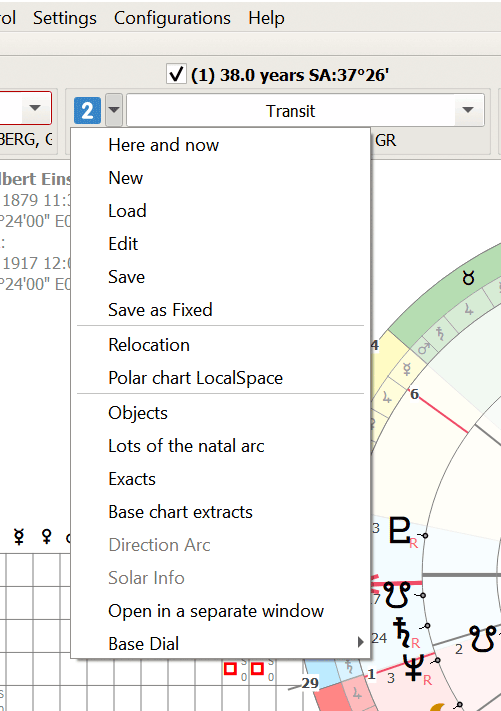
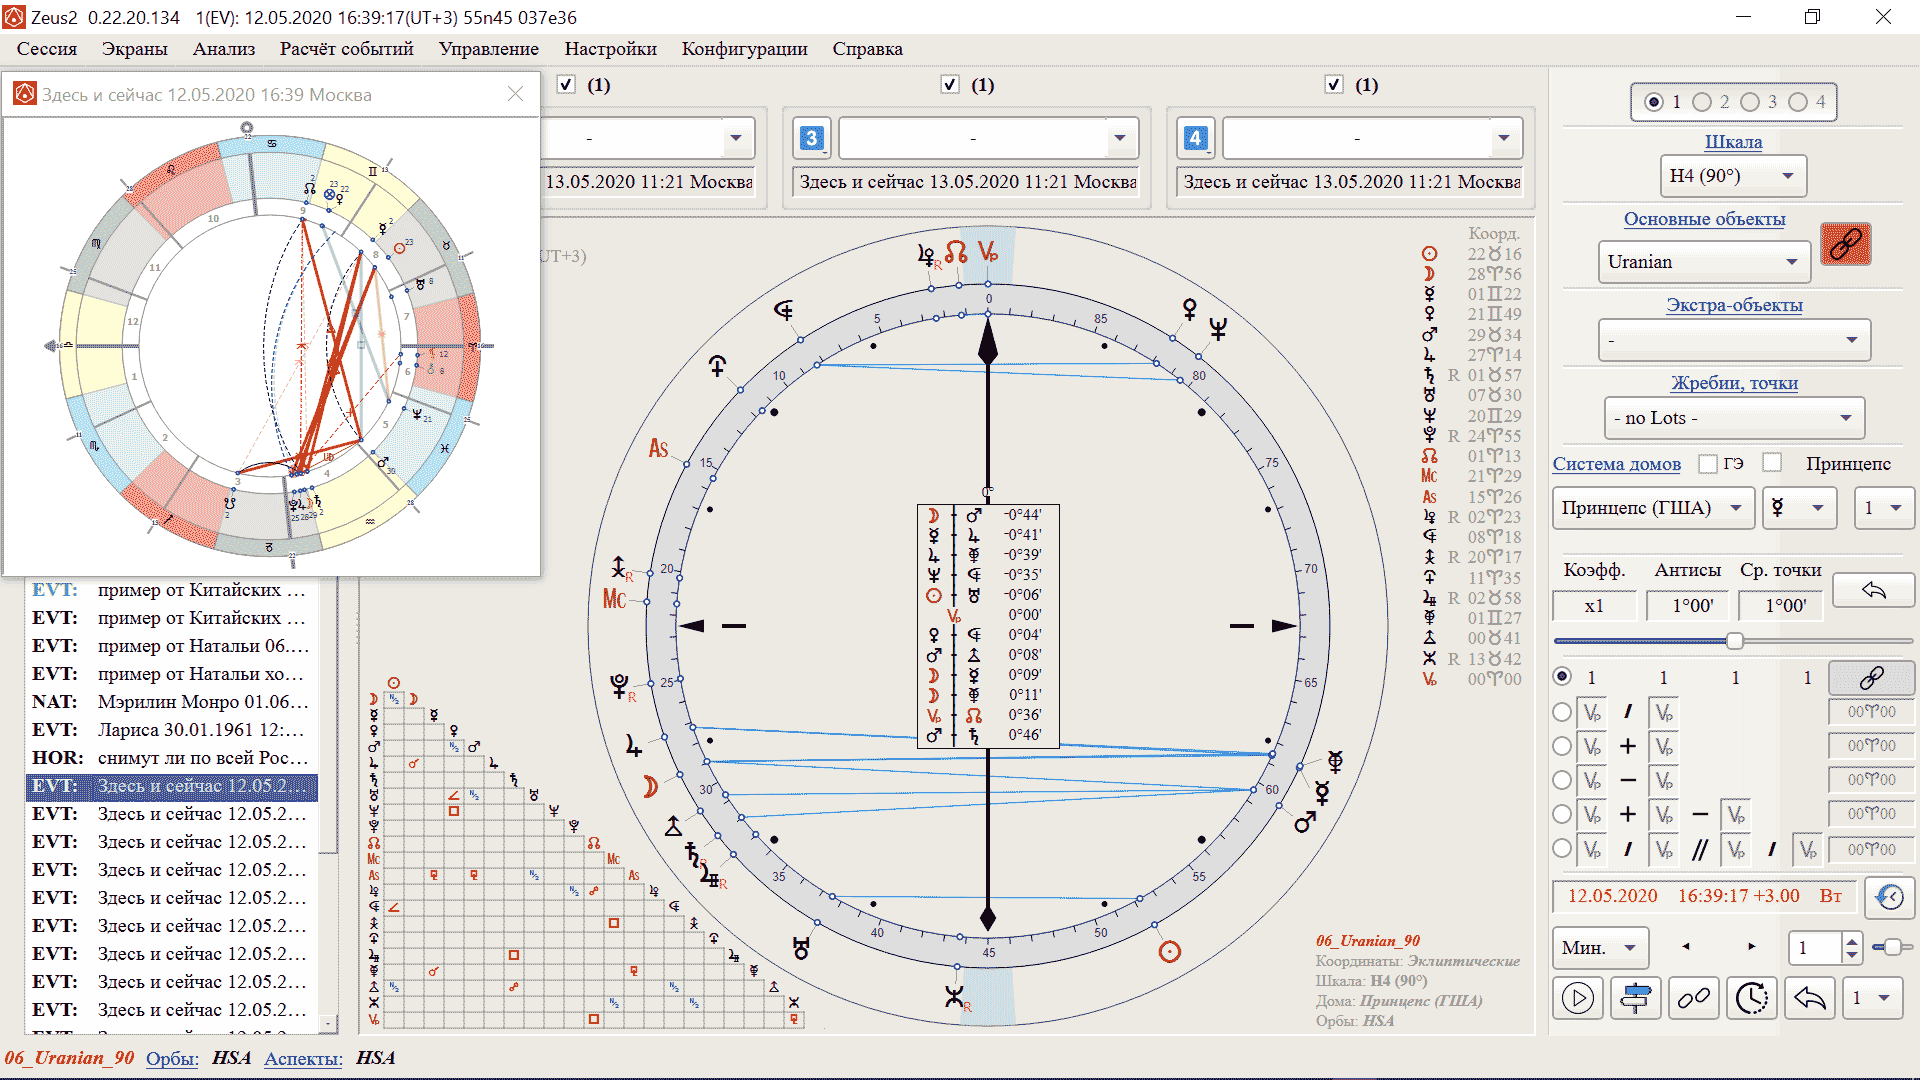
Designed to control each of the 4 dials. It consists of 4 slots, each of which corresponds to a certain dial. The one on the far left corresponds to the 1st (Base) dial. Each of these slots has its own controls. Let's look at them in more detail:
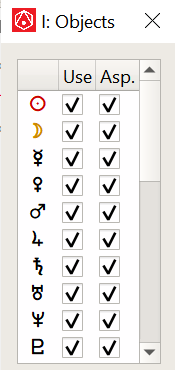 In this window there is a context menu, through which you can quickly perform various combinations for displaying or aspecting objects.;
 In the drop-down settings window, you can select: the dial - relative to which the calculation will be made, the designation of the Point, and the parameters of the direction;
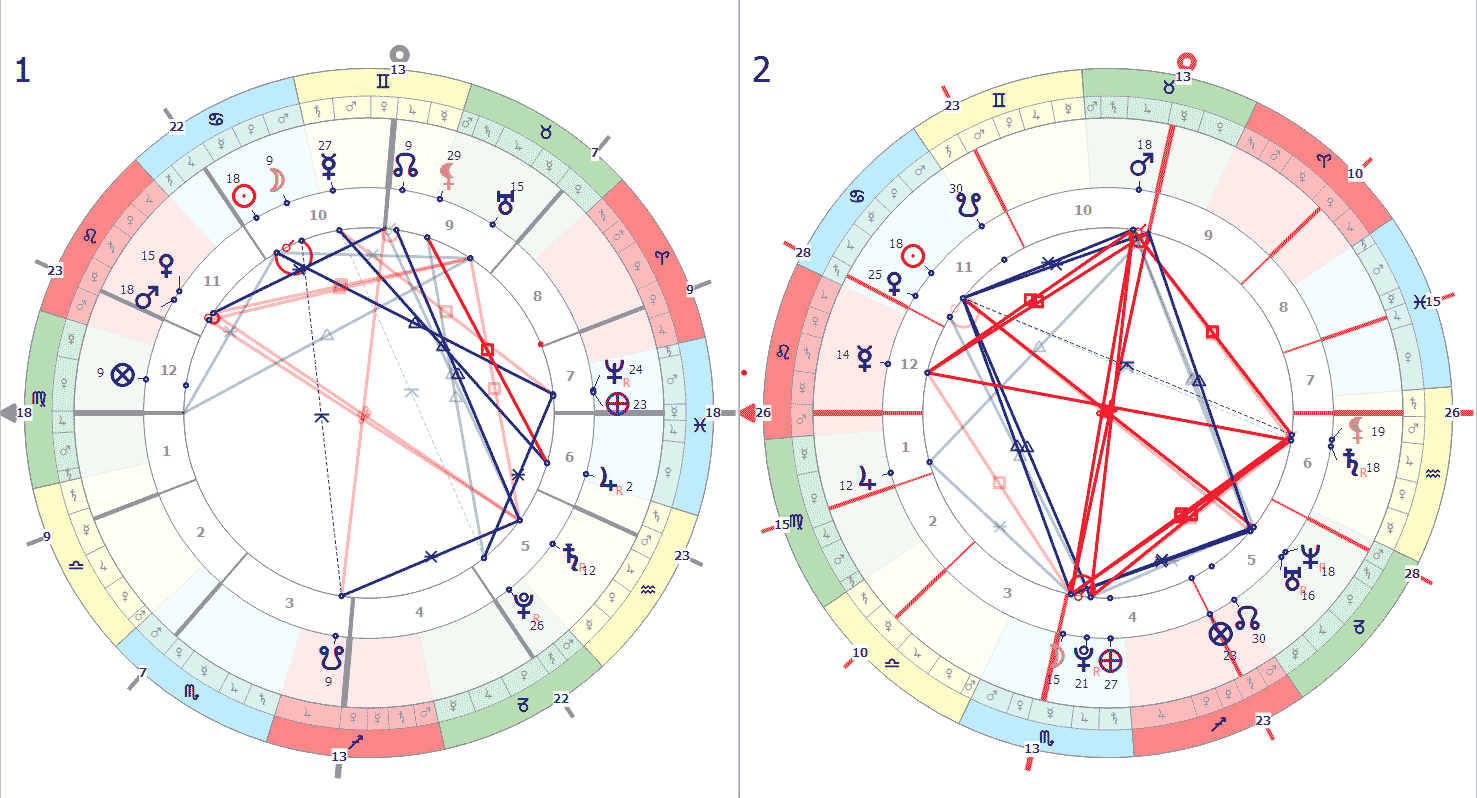
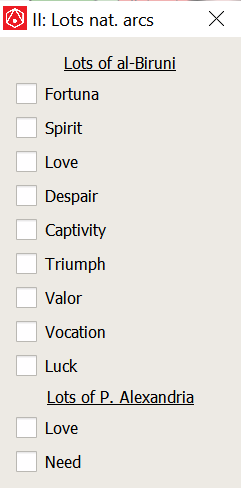 — They were mentioned by William Lilly in "Christian Astrology" in chapter CLXXII ("On revolutions"). They can also be found in D. Frawley's book "The Workshop of a Traditional Astrologer" in the first chapter "On the Architecture of the Soul". The essence of the technique is that a natal arc is calculated between certain planets, and then it is added to the Ascendant (or Meridian) of the solar chart. In the program, you can build them not only on the solar chart.
 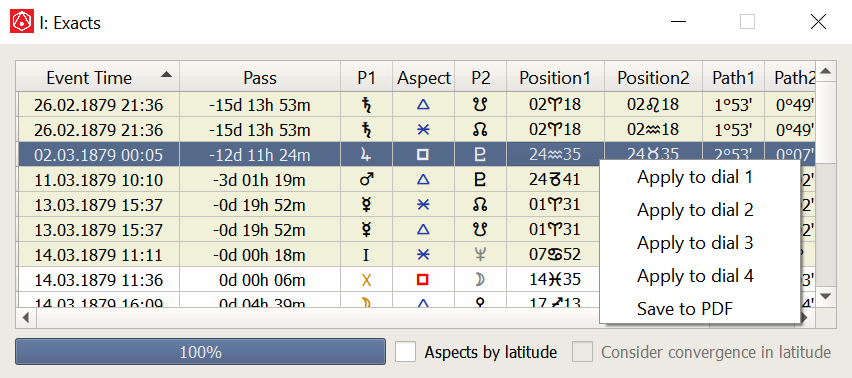 The lines highlighted in beige show events preceding the current chart event.
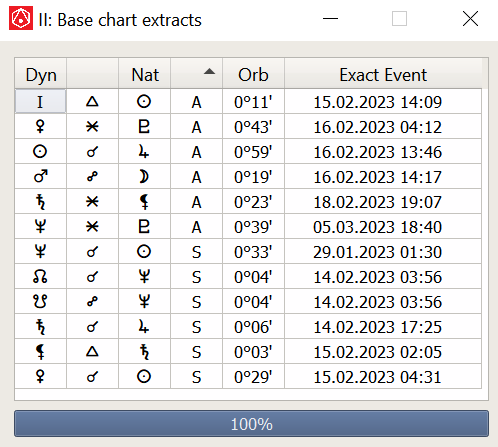 — calculated the exacts of aspects between the objects of the current and base with respect to it dials.
In case of convergence, the symbol "A" is used, in case of divergence – "S", if an object in the process of convergence / divergence begins to move away in the opposite direction from the direction to the object - "?", while the time and distance of the maximum convergence of objects are displayed. The residual values of the orbs and the types of aspects are also shown.
— calculated the exacts of aspects between the objects of the current and base with respect to it dials.
In case of convergence, the symbol "A" is used, in case of divergence – "S", if an object in the process of convergence / divergence begins to move away in the opposite direction from the direction to the object - "?", while the time and distance of the maximum convergence of objects are displayed. The residual values of the orbs and the types of aspects are also shown.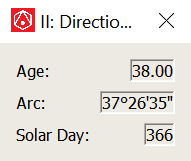 — if the chart type of this slot is any directions, then the window that opens will show: the age of the native, the solar arc, as well as the number of the solar day for the time of this dial relative to base chart.
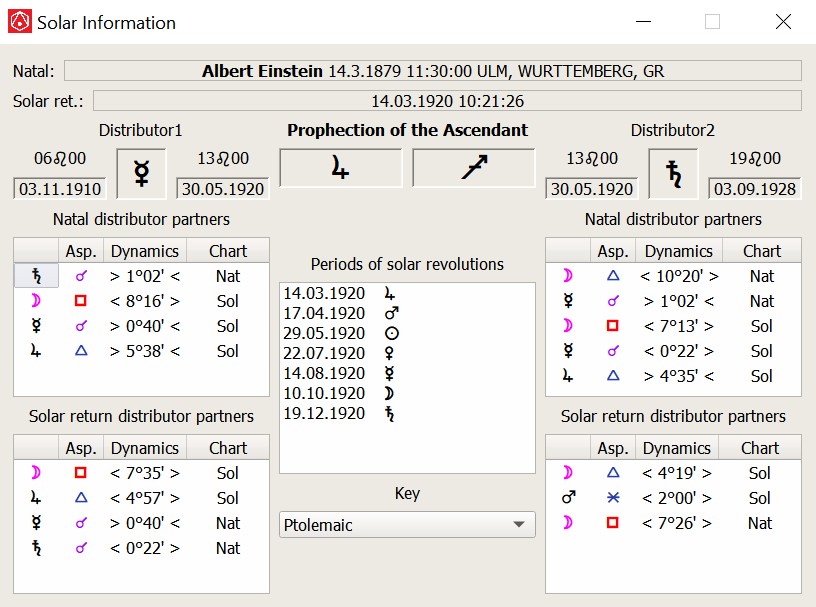 Calling this command opens a window with information on this solar: profectional ascendant, distributors (managers of ascending terms), partners (planets in aspect with distributors), partner aspects, periods of solar revolutions (according to Vetti Valens - from the manager of the profectional Ascendant and according to Martin Florentine - from the manager of the solar Ascendant), start and end dates the board of distributors. There may be two distributors. This is in those years when their change takes place.
 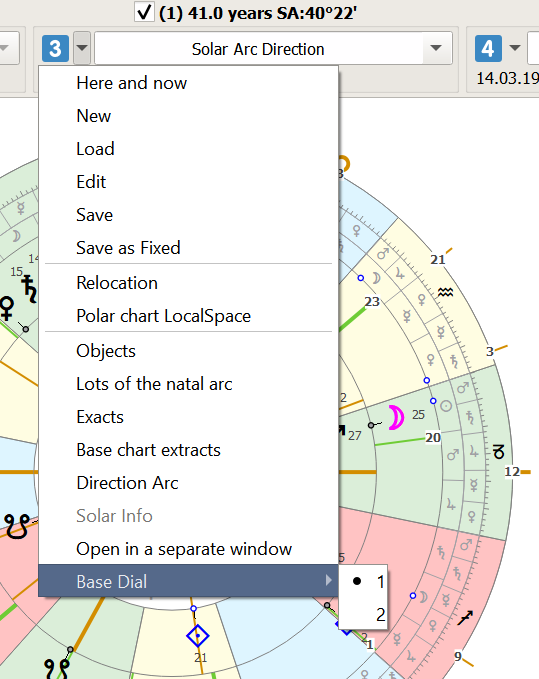 For example, you need to build a Solar Return Directions. To do this, you can build a Solar Return in the 2nd dial.
It is built for the data of the base dial. And in the 3rd dial - its directions, specifying the base dial - 2. By default, the base dial for all is the 1st.
For example, you need to build a Solar Return Directions. To do this, you can build a Solar Return in the 2nd dial.
It is built for the data of the base dial. And in the 3rd dial - its directions, specifying the base dial - 2. By default, the base dial for all is the 1st.

Each slot has a list of card types. This list is edited in the window chart type editor, which is called or from the menu Settings/Basic preferences/Cards/chart types or from the context menu of the circles panel - "chart types".
In this window, you can create your own sets of the presented types of charts, as well as your own types of charts (directional, progressive, thematic, return charts).
Events in the upper panel can be dragged with the mouse from one slot to another. To do this, click on the event data line of one of the slots, and pull it into a similar window of another slot. If you want the slots to change events, press the Alt button when dragging.

The left panel has 3 areas: Event Info, Event Pool and Session Pool. The event pool is a temporary database that is always at hand. It contains newly created events or downloaded from the database, as well as those that are generated while working with the chart. For example, when building a Solar Return, with the Auto-saving of ref. events, a reference date will be added to the event pool, i.e., the data of the solar itself. Similarly, when creating a new event, it will also be added to the event pool, provided that the Auto-save events.
Events that are already saved in the main database will be highlighted in an alternative color, which will allow you to quickly assess which events are saved to the database and which are not. Otherwise, they can be forcibly saved. But even if you forgot to do it, the program will save all temporary events to a special file after closing, and when you call the program again, you will see them in the same window.
Also, this panel has a context menu, thanks to which you can:
When dragging events with the mouse inside the event pool, automatic scrolling works.
Also, from the context menu, you can build a chart of Solar Equations, an Average Chart or a Composite for selected events. The calculated events will be added to the end of the event list.
You can create any number of pools (pages), name them, rename them, delete them, sort them. When exiting the program, the order of the pool pages and the index of the current page are saved. The options are located in the context menu of the event pool header.
The width of the left panel can be changed by hovering the mouse cursor over the border between it and the scene (the cursor will change), and clicking the left mouse button, pull in the desired direction. The width of the panel is saved in the configuration.
Event Info - contains detailed information about the selected event in the event pool.
Session pool - this window shows all sessions saved in the selected folder. The current session folder can be selected from the context menu or by clicking on the name of the current folder. You can perform various actions with sessions right from here: save, rename, delete. Sessions are loaded by double-clicking. The list can be sorted both by name and by creation time. If the window is hidden, you need to move the mouse cursor to the lower border, and when the cursor changes, pull this border up.
The relative sizes of these windows can be adjusted with the mouse by clicking on the borders between them and pulling in the desired direction. And if the configuration is saved after that, then these dimensions will be preserved.
Contains various controls. It can be configured from the menu Settings/Operational panels/Setting up panels. You can fill the panel with both icons that duplicate some elements of the main menu, and widgets – the controls themselves. You can quickly access the panel settings from the context menu.
Contains information on various configuration settings. You can also quickly open windows with these settings from it. You can enable/disable it in General settings. Configured in the menu Settings/Operational panels/Setting up panels. You can quickly access the panel settings from the context menu.
The scene is a large part of the program window in which a graphical display of the calculated data is displayed.
There are 3 modes that can be switched from the main menu "Scene":
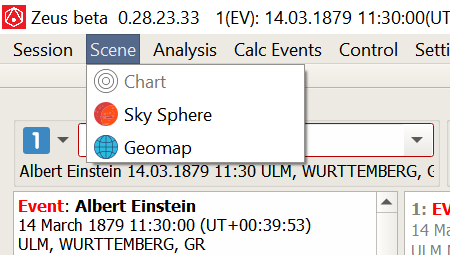
Now learn more about each of these modes.
Standard astrological charts are displayed on the stage (with objects, with aspects between them, with cusps, with coordinates of objects and cusps, etc.). Tables can be displayed. To do this, the option in the menu Settings/Scene Tables. Many of these tables are analogs of the main calculation tables called from the main menu. More information about the Scene Tables can be found in the description of the setting scene layout.
Customizing chart elements (sizes, colors, layout...) produced from the menu Settings/Chart.
Setting the size of the chart and the surrounding tables from the menu Settings/Layout. When this window with settings is open, you can move the chart or tables around the scene with the mouse.
Most of the scene tables also have their own context menu with various options.
If the option Scene Tables is deactivated, a single chart will align to the center of the scene, and automatically scale, taking up the maximum available space.
The scale of the scene can be changed quickly with the mouse wheel, holding the Ctrl key. Moving around the scaled
space is possible by using the mouse wheel without Ctrl (up-down) and holding Alt (left-right), or by using the arrow keys.
Sometimes it is necessary that markers, objects and names of extra objects are not scaled, so that by scaling
distinguish those elements of the scene that are normally hidden behind other elements. To do this, when zooming,
simultaneously with the Ctrl key, you need to hold down the Shift key.
You can return to the original scale by clicking on an empty space of the scene while holding Shift.
There is an alternative version of the chart that differs from it by a different combination of elements.
The alternative chart is configured in Settings/Chart/Chart Elements.
 You can switch to an alternative chart and back in the menu Settings/Alternative Chart or in the context menu of the scene, or with the "Q" hotkey.
chart objects include:
chart objects are selected and configured in the Settings menu/Object Catalogs.
chart elements include:
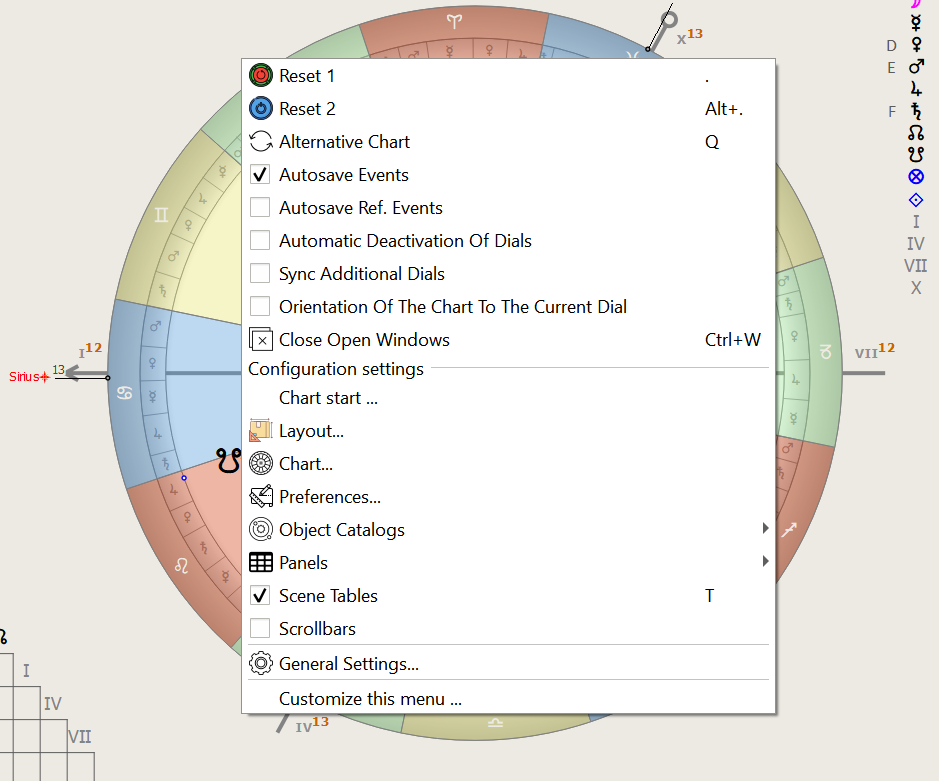
In the scene area there is a context menu called by the right mouse button, with which you can get quick access to various menu items of the program. The context menu is configured in Settings/General Settings/The context menu of the scene or from the bottom line of the context menu itself.
When the mouse cursor hovers over various chart objects, tooltips are displayed. For objects, cusps, and aspects, they are configured independently in the menu Settings/Chart.
If more than one dial is displayed on the chart, then from the context menu of the scene (by right-clicking on the free area of the scene), you can activate the "Multi-map" option, as a result of which the coaxial view of the chart (dials) will change to a separate display of charts of each dial. You can enable/disable this mode by pressing the "M" hotkey.
 You can open the aspect dynamics window by clicking on the selected aspect on the chart, or by selecting "Aspect Dynamics" from the aspect context menu, or by clicking on the selected row of the scene table "Aspect List".
In this window, the horizontal axis is the time axis, the vertical axis is the axis of the distance value between the two selected objects. You can choose a scale when one division of the scale corresponds to: 1 hour, 1 day, 1 month, 3 months or 1 year. With the horizontal slider, you can move the time axis forward and backward. You can use the vertical slider to scale the distance axis.
The following elements are also present on the graph for the convenience of visual orientation: the current time line, the exact line, the aspect line, the orb area. The dimensions of the orb region depend on the aspect itself in the chart: if it is convergent, then convergent values of the orbits of objects are used, if divergent, divergent.
At the top of the graph, dynamic data is reflected, depending on the current position of the mouse on the graph: date, arc and the residual value of the orb.The header of this window reflects the initial data of the aspect: the aspect itself; the objects between which the aspect; the dials to which the objects belong; the value of the orb.
We get access to user settings from the context menu:
You can also control the vertical scale of the graph using the mouse wheel. If you hold down the "SHIFT" key at the same time, the time axis will shift. If you also hold the "ALT" key at the same time, then the changes will take place with a large step.
You can quickly recalculate the current chart for the time of the execution of any selected aspect. The option is present in the context menu of aspects - "Set the time of the exact".
Using the context menu of objects, you can:
Using the context menu of aspects, you can:
Output of calculated objects in 3D. In addition to objects, you can display circles of houses, the main astronomical points, circles and axes.

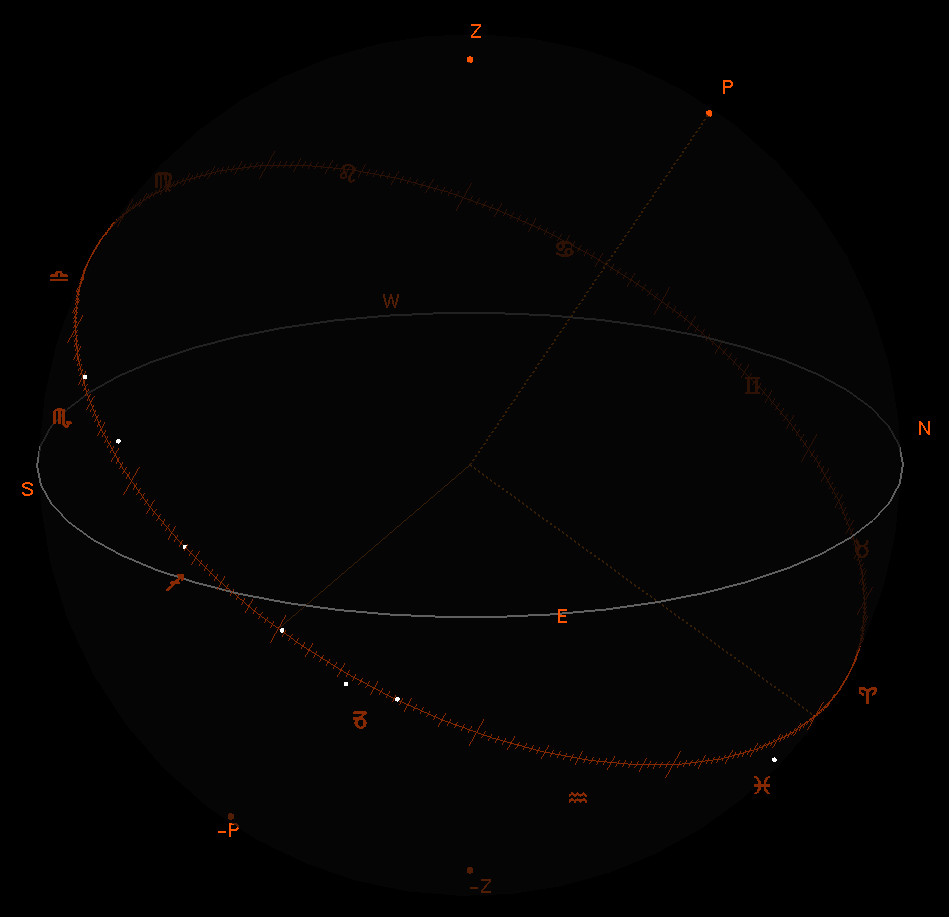
The Sky Sphere is configured in the menu Settings/Sky Sphere.

This mode is needed to display various calculation lines or objects on a geographical map. In parallel with the geomap, standard charts can be shown in the left part - one of them is radix (lower), the other is relocation (upper). The relocation chart synchronously reacts to changes in the geomap at the moments of relocation.
Opportunities:
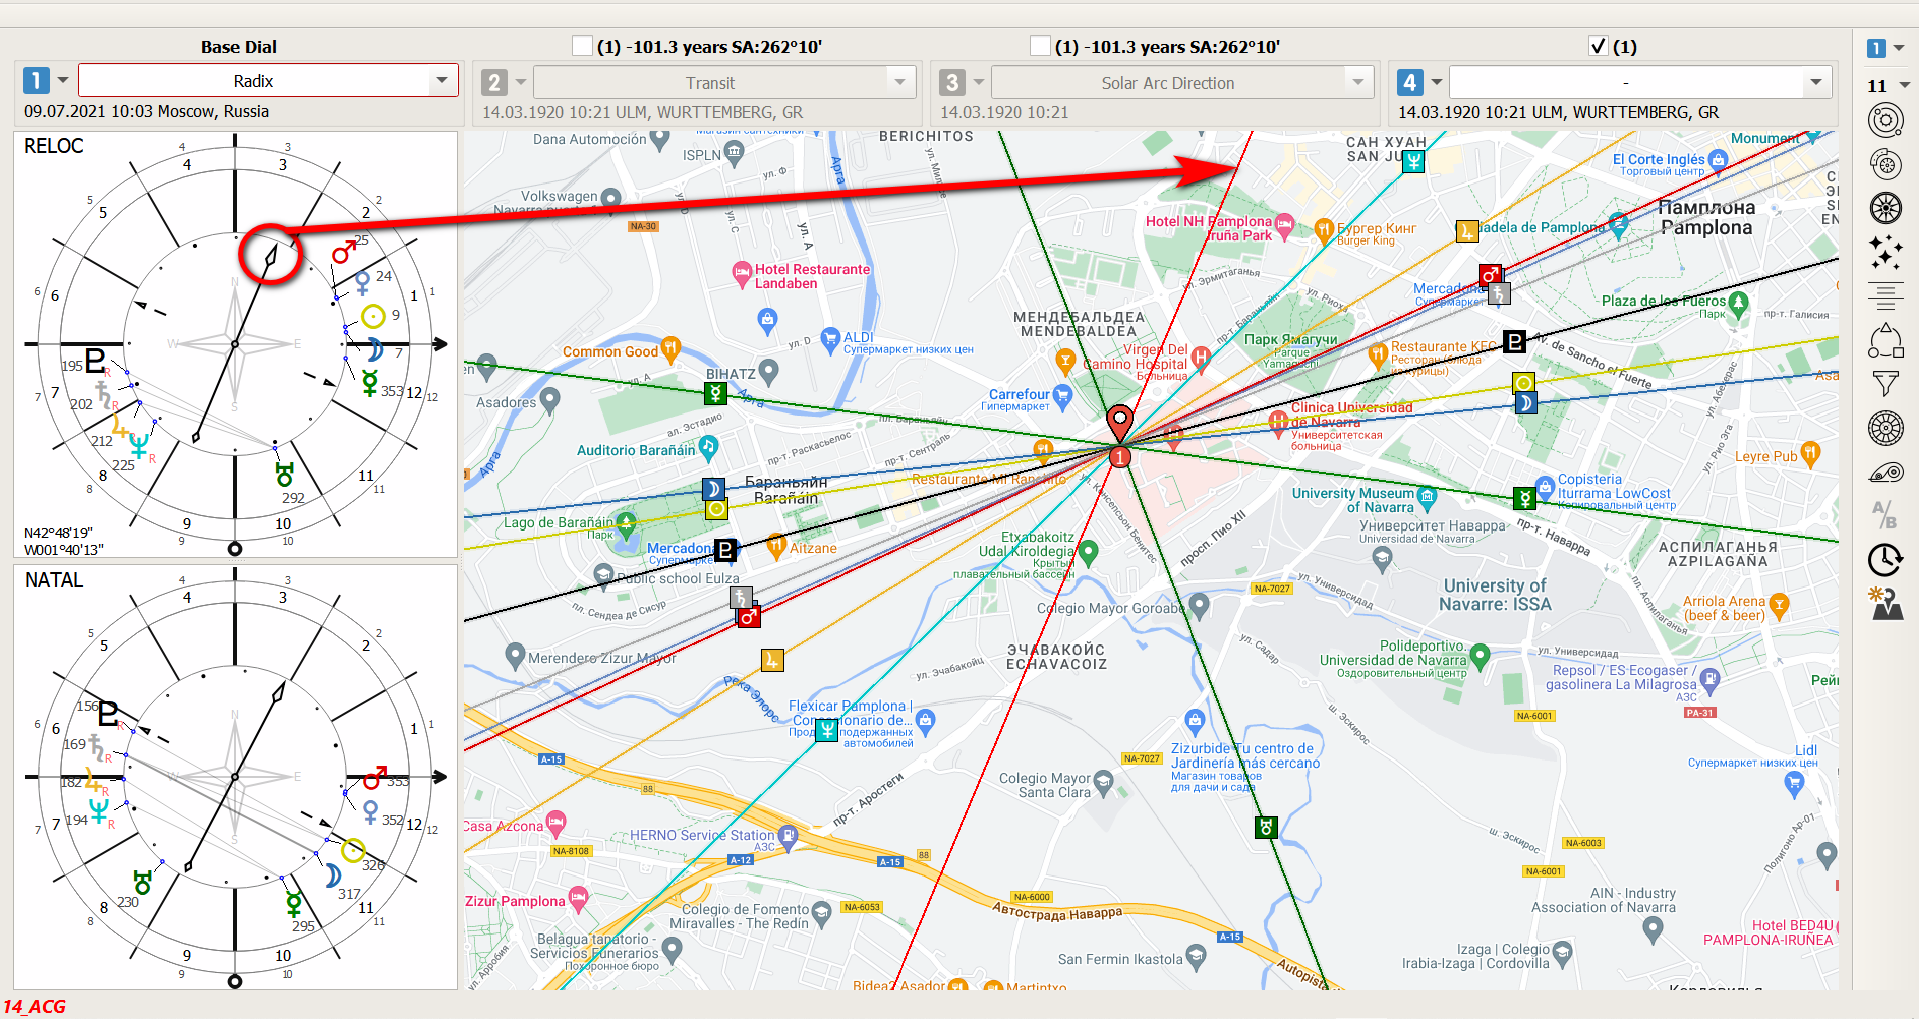
The main geomap settings are in the menu Settings/Geomap.
zeus website